J WAYNE GRAVES JR. Operation Leader, Automation Expert and Quality Improvement Specialist. Eight pen-drawn birds slowly form from ink, then remove sixteen pieces of paper, thread, leaves, ribbon, twigs and tangled debris from three sagging utility wires. A spreadsheet forms behind them. The name and professional title stay visible. The approximately fifteen-second animation plays once and then rests.

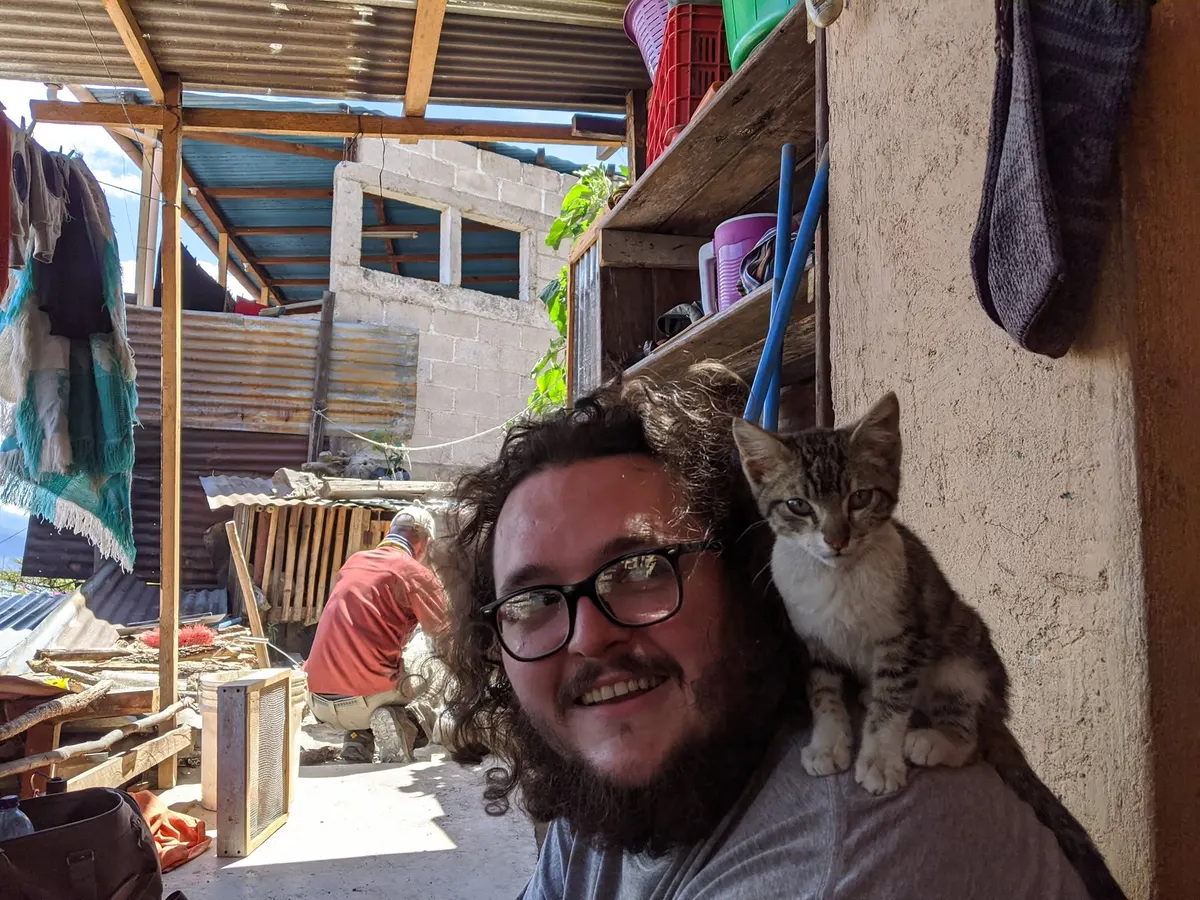
J Wayne Graves Jr smiling with a cat on his shoulder

Operations · Automation · Quality improvement

I turn recurring quality problems into clearer ways of working.

At Wipro, I manage a 20-person operations team while serving as Quality Lead for an 80-person line of business.

I investigate recurring errors, turn findings into practical guidance, and work with specialists and team leads to make improvements useful in everyday work. I combine operational judgment with data review and AI-assisted implementation.

20people
Direct operations-team management
80person line of business
Concurrent responsibility as quality lead

01 Genetics Support Tool

Clearer guidance at the moment of decision.

A recurring problem. A revised question set. Practical support for the people doing the work.

Investigating recurring errors

Experienced agents were making recurring errors while processing genetics prior-authorization requests, despite training and extensive job aids. My investigation pointed to guidance that was difficult to apply under processing-time constraints.

I classified error records and reviewed individual root-cause narratives to identify decisions that needed clearer support. From those findings, I drafted questions to guide agents through the process.

Collaboration changed the solution

I took my initial questions to the Nurse Supervisor whose team reported the errors. Together, we refined and expanded the question set to better target the problem.

I authored the operational content: questions, answers, corrective callouts, email templates, and decision logic expressed in pseudocode. AI converted that pseudocode into the local HTML/CSS implementation.

From implementation to everyday use

I rolled out the tool in May, demonstrated it and ran one rollout refresher for each team; it is used by five teams across the 80-person line of business.

The team leads and I use the tool to coach our teams.
02 Results in context

What the numbers show.

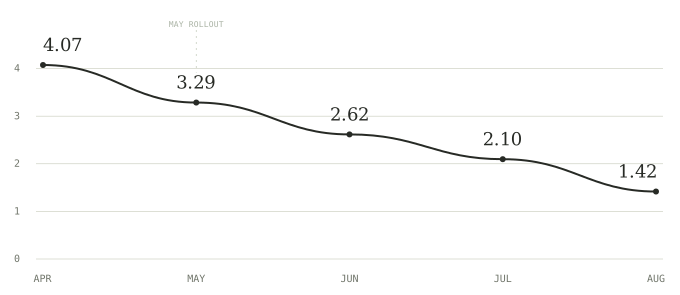
2.62 to 1.42

Overall reported errors per 1,000 cases
June to August

45.8% relative decline

Reported errors / 1,000 cases
Full-operation monthly figures
MonthCasesReported errorsErrors per 1,000 cases
April37,5481534.07
May38,6491273.29
June40,1251052.62
July37,205782.10
August45,866651.42

Rates are reported errors divided by cases, multiplied by 1,000. The relative decline is calculated from the unrounded June and August rates.

03 Synthetic Genetics Governance Report

Checking the meaning behind the metrics.

A report can reconcile correctly and still lead to the wrong conclusion if its populations or definitions are unclear.

This self-directed Power BI report uses synthetic data and presents four static views.

It demonstrates KPI/governance reporting design and data storytelling.

The report shows how different definitions can change a result—and why a passed check does not automatically make a metric trustworthy.

View the Governance Report Select a page to read it in full.

A conversation is a good place to start.

Let’s make complex work easier to do well.

I’m interested in opportunities to lead operations, improve quality, and develop practical automation.

If your team needs someone who can investigate recurring problems, involve the right people, and turn findings into clearer ways of working, I’d welcome a conversation.

jwaynegravesjr@gmail.com

Synthetic portfolio demonstration

Governance Report

Selected page of the synthetic Genetics Governance Report

From the same sheet of paper

J Wayne Graves Jr · Résumé